Measuring Retention For Startups
Written by Neil on June 26, 2015

Getting new customers is fun. Losing customers is not.
‘If you’re committed enough, you can make any story work. I once told a woman I was Kevin Costner, and it worked because I believed it.’—Saul Goodman, Breaking Bad
An easy way to measure your results over time is to track your retention rate. Tracking your retention rate gives you an honest perspective on how your startup is really doing. This way you can have a mature discussion with your investors and co-workers, measuring retention is important.
Data Don’t Lie
Pirate Metrics (AARRR!)
Retention is part of pirate metrics, a simple growth hacking framework by Dave McClure, the founder of 500 startups.
The framework tracks 5 key metrics for your business and customers and how you can apply it to your product and marketing efforts.
Acquisition: users come to site from various channels
Activation: users enjoy 1st visit (“happy” experience)
Retention: users return visit site multiple times
Referral: users like product enough to refer others
Revenue: you make money!!
Measuring Basic Retention
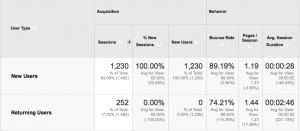
A rough way to measure retention is by using Google Analytics, a free web analytics service offered by Google that tracks and reports website traffic. Login and select a date range e.g a month. Next click on Audience. Then click on Behavior and select New vs. Returning. Then click on the +Add Segment button at the top. Tick the new users box and the returning users box, and then hit Apply. Here’s an example of what you might get.
It’s not perfect but can give you a quick overview of whether people are engaged on your website and return for more information.
Retention = User Happiness
Retention Examples
Let’s say, for example, you have created a super cool music app and charge $8.99 a month (sound familiar!). The following could be examples of retention.
- Signing back into the dashboard 30 days after a new user has signed up.
- Opening the app a second time and playing at least one song.
- Writing a review and rating. i
- Inviting others to use the app
The whole point the of doing this is to measure the success of your product, which repeat usage of your product will be an indicative measure of “building something people want.”—The Holy Grail!
Measuring Advanced Retention
“I’m deep undercover now, this is deep, but I’m goin’ deeper. I’m goin’ deep, deep deep, deep undercover.”—Axel Foley, Beverly Hills Cop 2
Cohort Analysis
To go really deep you need to understand cohorts. Cohorts are simply groups of people who visit your website or use your app over a certain period of time. This could be 7 days, 14 days , 21 days, a month etc.
So what you could do is track users by month, say in January, and track them over a period of time. Will those people who created accounts in January return in March? You can track this.
One of the most popular cohort analysis for startups is studying your customers by how they were were originally referred to your startup e.g. Facebook, direct, blog , email or Google etc. Group them together and track how much money they spent over time if you have an ecommerce website. From this example you can see how your customers are behaving based on the platform they are using.
Example Cohort Analysis
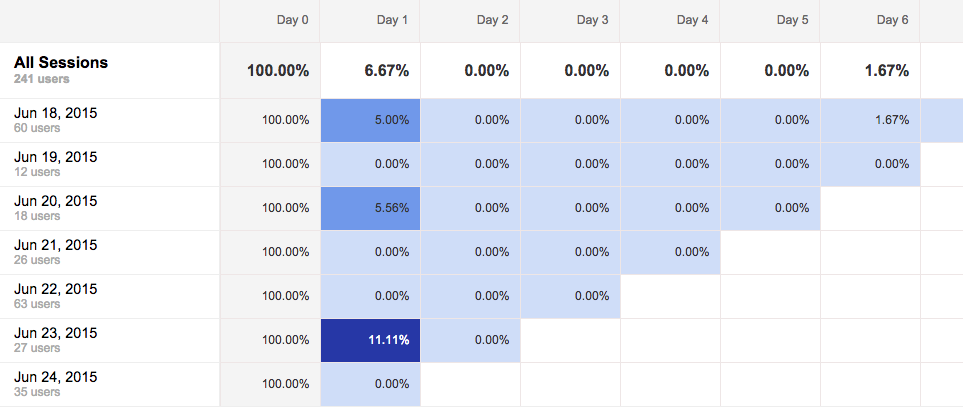
Google analytics has a feature called, funnily enough, cohort analysis! To use this click on audience on the left hand side, select cohort analysis, and at the top it will give you options for the last 7 , 14 , 21 and 30 days. You will get something like this:
The above table gives us an understanding of the percentage of people returning to your website within 7 days of visiting it for the first time.
Day 0 corresponds with the date are in the first column. Day 1 is the first day after someone visits your website for the first time. So the 5.00% at Day 1 in the June 19th row means that 5.00% of the people who visited the website for the first time on June 19th, visited the website again on the next day (June 20th). Day 2 is the second day (June 21st), and so on.
Retention Is King
Example Music App
Let’s go back to our music app. We could create a report to tell us how many customers used the app and then returned to try it again. They could even check other metrics, like the genre of music they listen to, the country they come from, the time of day they logged on, etc. Other things you can check
- Users haven’t completed your onboarding process
- Users are only using part of your app or service
- Users aren’t engaged with the core value of your app or service
So, if you find something similar then here are a few suggestions you can implement, using the music player as an example.
- If a customer creates a profile, then send a welcoming email.
- If the stats show the customer hasn’t used the music app for 14 days, send a reminder email, but make it interesting!
- If the customer has not used your core feature , send them an email telling them about this feature.
- If you notice the customer has listened to 3 tracks, remind him about the discounts available if he/she refers friends to the app.
Improving Retention
I used Airbnb last year while living in London and had a great experience, so let’s see what they did to get me back to the website.
- An email about how to prepare for a trip—getting to know the host, coordinates for checking in, etc
- A £16 Airbnb credit if I invite friends to Airbnb via email or share the referral code on Facebook or Twitter.
- A reminder to login and leave a review of the host
- An email to let me know the host has left a review of me and to login and read it because it’s public
So as you can see, its not sneaky, salesy, cheesy or even creepy. The copy, design and personalization are spot on. They do a great job with keeping me interested.
Another example is Linkedin. To increase retention they will notify you about endorsements, skills , birthdays, anniversaries etc. Check out how Pinterest, Twitter and Facebook increase retention.
Homejoy
Homejoy the cleaning services company shut down recently, even after raising $40 million in funding.
The co-founder Adora Cheung suggested this was down to lawsuits on whether Homejoy cleaners were employees.
However, according to the forbes.com website, what really killed Homejoy was it couldn’t hold on its
customers.
“Retention was clearly bad, and that’s what killed us” – Ex Homejoy employee
It seems 15%-20% Homejoy’s customers booked again within a month. Similar competitors had a 35-35% retention rate. Homejoy focused on the push for high growth numbers instead of fixing its poor retention rates. It can be very hard to grow, if you’re customers are not coming back..
full article here http://www.forbes.com/sites/ellenhuet/2015/07/23/what-really-killed-homejoy-it-couldnt-hold-onto-its-customers/
Data Is Your Friend!
Final Thoughts
You probably know your acquisition rate, but very few startups have deep knowledge of their retention rate. By knowing the retention rate you can have a great influence on your marketing campaign.
For example, if you have a low number of returning customers, then you’re not providing value to your customers, and you need to improve your social media and email marketing. It may be customers are not coming back because you’re not explaining the core value of your product properly, so you can try a video
I believe that without retention you don’t have a business! if you crack this, then you are on the right path to get to the perfect product/market fit. If you have validated your product and built something that people want, revenue will take care of itself
—hallelujah.


